OpenSkiStats: a global webapp of geospatial ski area metrics reveals the orientation of alpine skiing
Daniel Himmelstein 
Trang Le
Joshua Himmelstein
This manuscript is an incomplete in-progress draft.
Abstract
We present OpenSkiStats, the first open, global, and continuously updating resource of downhill skiing summary statistics. The initial focus of OpenSkiStats is to provide spatial statistics of ski areas and their runs, in particular, the orientation of ski runs. Data is sourced from OpenSkiMap, a project to extract and visualize skiing related features from the crowd-sourced OpenStreetMap. OpenSkiMap provides a resource of 6,951 downhill ski areas in 70 countries and 97,457 downhill ski runs comprised of 1,344,461 segments.
Introduction
There are an estimated 135 million alpine skiers worldwide, resulting in 350-380 million visits to ski areas per year [1]. Mountain tourism is estimated to drive up to 16% of international tourist arrivals worldwide (~375 million in 2019) [2]. In the United States, outdoor recreation accounted for 2.3% of the gross domestic product in 2023 by adding $639.5 billion in value to the economy. $3.9 billion directly [3]
In the United States, outdoor recreation generated $1.2 trillion in economic output or 2.3% of the gross domestic product in 2023 [3, Table 10]. $3.9 billion in value added is directly [3, Table 2]
Existing scholarly literature related to downhill skiing is limited and primarily focuses on economics [4], health impacts, avalanche science [5], environmental sustainability [6,7,8], the threat from climate change [9,10,11,12,13], or ski trail routing algorithms [14,15]. We present one of the first scholarly accounts of the spatial metrics of ski areas on a global scale.
An open and global database and analysis of ski areas will help inform skiers, while providing insights to industry stakeholders. There are a variety of existing resources that compile information of ski areas. Both OnTheSnow and OpenSnow contain a global database of ski areas and metrics, with a focus on snow and weather conditions. However, neither makes their source code or data openly available. Stuart Winchester maintains several manually curated tables of ski areas, which are discussed in articles on the Storm Skiing Journal and Podcast. Laurent Vanat reports on aggregate ski areas metrics in his annual International Report on Snow & Mountain Tourism. Other resources focus on specific regions including New England Ski History, Wikipedia’s Comparison of North American ski resorts, and Vertical Feet. Other resources focus primarily on ski lifts, including Liftie (open source) and Lift Blog. Skimap.org compiles official trail maps produced by ski areas.
Here we base our analysis on OpenStreetMap and OpenSkiMap.
OpenStreetMap is a collaborative map of the world available under an open license. Since its launch in 2004, geospatial data has been continuously contributed by a global community of volunteers and companies [16]. The platform’s crowdsourced nature ensures frequent updates and granular detail, with contributors adding information on features such as roads, buildings, natural landscapes, and, crucially for this study, ski areas and their trails and lifts. Individual users often contribute to specific domains. For example, study author Daniel Himmelstein previously helped complete and align the Long Trail, a long-distance hiking trail in Vermont [17]. Meanwhile, the company Amazon contributed missing roads, driveways, and vehicle routing restrictions to aid in their delivery operations. This mosaic of interests has resulted in an exceptionally broad and diverse collection of volunteered geographic information, albeit with varying levels of detail by region. This breadth along with OpenStreetMap’s open license and availability have made it an invaluable tool for extracting and analyzing spatial data across a range of scientific disciplines [18].
OpenStreetMap provides its own general purpose frontend to view a rendered map of the world. Specialized frontends have arisen to refine, analyze, and render maps for particular applications. Examples include OpenRailwayMap for railroads, OpenCycleMap for bicycling, Waymarked Trails for hiking routes, OpenSeaMap for seafaring and nautical pursuits, Wheelmap for wheelchair accessibility, and Open Infrastructure Map for electrical and telecommunication transmission. OpenSnowMap and OpenSkiMap display both nordic and alpine skiing information.
OpenSkiMap refines data from OpenStreetMap along with Skimap.org to create an interactive map of the world that highlights ski areas, runs, and lifts along with associated metadata like run difficulty. OpenSkiMap is created and maintained by Russell Porter, with much of its code openly available. OpenSkiMap releases refined datasets of ski areas, runs, and lifts as GeoJSON downloads that update daily. Since OpenStreetMap does not include granular elevation data, OpenSkiMap incorporates TerrainRGB, which merges elevation data from multiple providers. Global coverage is provided by the Japan Aerospace Exploration Agency (JAXA) AW3D30 [19].
The founding motivation of this study was to examine trends in ski trail orientations. The orientation of a ski trail is a major influencer of sunlight exposure. On a local level, orientation affects weather patterns and climate, although in less generalizable ways than it does sunlight. We were unable to find a systematic analysis of or database containing ski trail orientations. In 2006, Alpine Zone Forum user Jonni compiled a manual and qualitative list of the primary orientation for 37 ski areas in Vermont, Maine, and New Hampshire. Hence, we set out to create a global, continuously updating, open, and accessible resource for browsing ski areas and their orientations.
A second motivation was Geoff Boeing’s analysis — first by blog and later publication [20] — of city street orientations from OpenStreetMap. Boeing tabulated street segments by their orientation into polar histograms (i.e. roses) to show whether a city’s roads were neatly arranged into a grid like Manhattan or a spaghetti mess like Boston. Boeing released the modular code underlying his analysis in the osmnx Python package [21,22], which we use sometimes directly and other times as a reference. Boeing’s street roses take inspiration from wind roses, which summarize the direction of wind [23]. Wind roses themselves take inspiration from the compass rose, an ancient visualization steeped in tradition and symbolism [24,25].
Data completeness
Number of Ski Areas
OpenSkiMap contained 12,387 ski areas with 6,951 of those assigned a downhill usage.
Laurent Vanat’s 2022 International Report on Snow & Mountain Tourism compiled primarily national level data to report on global ski area metrics [1]. Vanat identified 5,764 ski areas worldwide, when limiting to “equipped outdoor ski areas covered with snow”, which excludes “indoor facilities, mountaineering-only areas, and other types of facilities such as dry slopes.” The 1,945 ski areas with 5 or more lifts qualified as a ski resort, of which 52 were deemed as major based on a threshold of “1 million skier visits per winter season”. OpenSkiMap contained 5,068 operating downhill ski areas with one or more lifts (i.e. equipped) and 1,632 with 5 or more lifts. This equates to 88% and 84% of Vanat’s respective counts. Vanat identified “68 countries offering equipped outdoor ski areas covered with snow” compared to 70 in our analysis.
Stuart Winchester identified 505 active ski areas in the United States as of 2023 [26]. Winchester required ski areas to have one or more lifts, a snow surface, operated for at least 1 day in the last season, excluding areas operating solely for personal use. OpenSkiMap contains 515 downhill, equipped, operating ski areas in the United States.
We observe a striking difference in the amount of skiing infrastructure between the northern and southern hemispheres. The northern hemisphere is home to 41 times the combined vertical drop, 45 times the number of runs, 49 times the number of lifts, and 61 times the number of ski areas than the southern hemisphere.
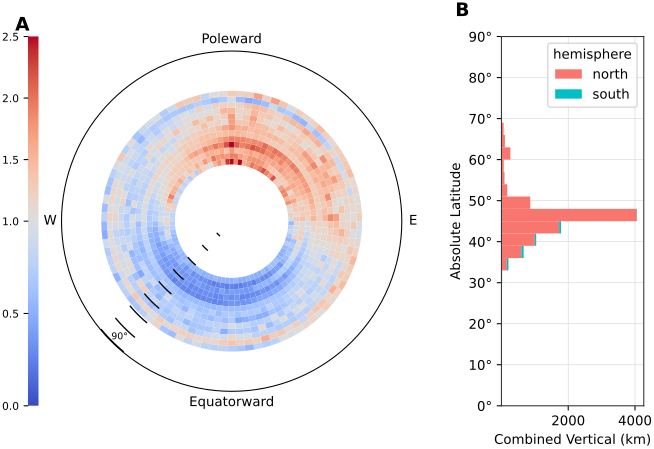
Skiing is further concentrated in the northern hemisphere within a narrow latitude band (Figure 5). 72.9% of the world’s skiable vert is located between 40–50°N and 43.0% is between 45–48°N.
Ski area concentration
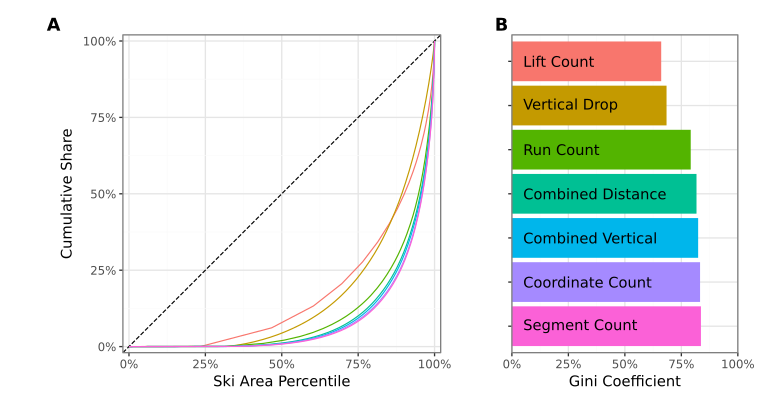
Ski areas vary enormously in extent, from a single backyard rope tow to sprawling interconnected resorts. We quantify this disparity with Lorenz curves and Gini coefficients for several ski area metrics (Figure 1). A Lorenz curve orders ski areas from smallest to largest and plots their cumulative share of the world total, while the Gini coefficient summarizes the curve’s departure from equality, ranging from 0% if every ski area were identical to 100% if a single ski area held everything. Skiing infrastructure is remarkably concentrated: the top decile of ski areas accounts for 71.1% of the world’s combined vertical and the top percentile alone for 25.1%.
Concentration varies by metric in an instructive order. Metrics that sum over a ski area’s runs concentrate the most, e.g. Gini coefficients of 84.1% for segment count and 82.8% for combined vertical. Vertical drop, at 67.9%, spreads more evenly, since the elevation difference between a ski area’s highest and lowest points is bounded by its mountain, whereas a resort can always cut more runs. Lift count is the most egalitarian metric at 67.2%, since even resorts with hundreds of runs operate only dozens of lifts. Note that these distributions span all downhill ski areas, including those without any mapped runs or lifts, so the observed concentration reflects mapping completeness in addition to true differences in size.
Orientation findings
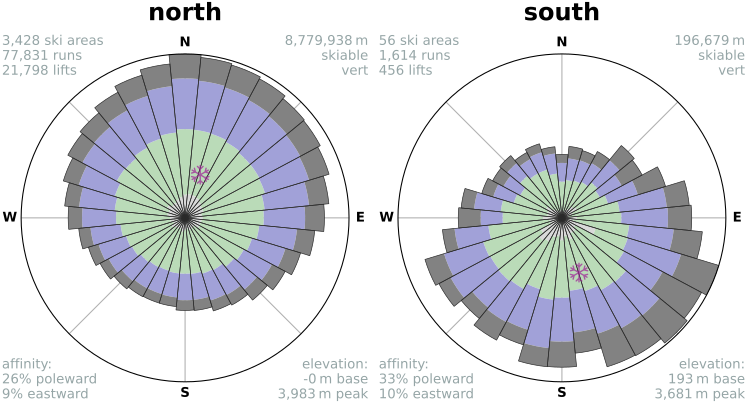
Downhill skiing overwhelmingly favors a poleward orientation. Across all ski areas, 67.0% of skiable vert descends on a bearing with a poleward component, i.e. northward in the northern hemisphere and southward in the southern hemisphere, for a poleward affinity of 0.26 (Figure 3). Poleward slopes receive the least direct sunlight, preserving snow through the season.
Ski trails also faces east, with an eastward affinity of 0.09. East-facing slopes receive their sun in the morning, when air temperatures are lower, and are shaded by afternoon, when the warmer air compounds melt. The same daily dose of sunlight therefore costs east-facing snow less than west-facing snow.
Poleward affinity declines with distance from the equator (Figure 5). Runs between 30–40° absolute latitude have a poleward affinity of 0.37, which falls to 0.26 between 40–50°, the band holding the majority of the world’s skiable vert, to 0.20 between 50–60°, and to 0.04 between 60–70°. Near the equator, the winter sun stays high and intense, so snow survives only where the terrain shades it. At high latitudes, the winter sun barely clears the horizon and delivers little irradiance to any slope, so orientation matters less to snow preservation and terrain, access, and wind can dictate where runs are cut. Cold air compounds the effect: melt requires the snow surface to reach 0°C, so irradiation that would melt snow in a mild climate merely warms it in a frigid one. Hence, ski areas face the pole in proportion to the solar irradiation their latitude would otherwise impose.
Deduplication of effort: OpenStreetMap used by Strava, mapy.cz, mapbox, komoot, REGRID etc. Single place to curate the world’s ski areas
From https://www.bromley.com/about/:
Bromley is the only major ski area in New England with a southern exposure, giving our guests sun-drenched smiles!
Discussion
Warren Miller once said, “The best place in the world to ski is where you’re skiing that day.” Miller’s quote is a useful reprise against decision paralysis or a fear of missing out by stressing that getting out and skiing somewhere along with a positive attitude are the necessary ingredients to a positive experience. Yet, it is undeniable that conditions and logistics make a big impact on the experience. Furthermore, each day skiing represents a large investment in terms of time and the cost of lift tickets, gear, and travel. Accordingly, OpenSkiStats serves the large contingent of savvy skiers who seek exhaustive metrics into ski areas. Such skiers meld observations on their own experiences with the data-driven insights provided by OpenSkiStats to create mental models on what factors of a ski area matter most to them and how these factors interact with conditions in search of the ultimate experience.
Open infrastructure for skiing. Open source is critical for longevity and preservation. collecting examples of ski infrastructure that have been lost
Methods
Data acquisition
We source data from OpenSkiMap, which refines OpenStreetMap into three GeoJSON datasets of ski areas, ski runs, and ski lifts. OpenSkiMap regenerates these datasets daily, and OpenSkiStats in turn reprocesses them weekly, such that the statistics in this study update continuously rather than describing a single frozen snapshot. The results herein derive from OpenSkiMap data generated on 2026-10-17.
OpenSkiMap processing
This placeholder section awaits a description of OpenSkiMap’s data model and processing. Questions the section should consider:
- History of OpenSkiMap: Who created and maintains it? Why? When?
- Which OpenStreetMap elements and tags become OpenSkiMap ski areas, runs, and lifts, and what does a single run, lift, or ski area represent after processing (e.g. are multiple OpenStreetMap elements ever merged into one run)?
- How are runs and lifts associated with ski areas? When OpenStreetMap lacks an explicit ski area, does OpenSkiMap infer one, e.g. by spatially clustering nearby runs and lifts? Can a run belong to multiple ski areas? How are overlapping ski areas handled, e.g. an interconnected mega-area like Dolomiti Superski whose runs also belong to member resorts like Alta Badia? Why are these associations unstable over time, e.g. entire federations appearing as new ski areas and Park City’s run count halving within months?
- How are run coordinates enriched with elevation: which terrain sources at which resolutions, how values are sampled along a line, and what failure modes remain (e.g. elevation voids)?
- How are metadata fields derived, including operating status, difficulty, and the regional difficulty coloring convention?
- How does location metadata (country, region, locality) get attached to ski areas?
- What cleanup or normalization does OpenSkiMap itself perform, so readers know which data defects are handled upstream versus by OpenSkiStats?
- What is the relationship between OpenSkiMap and Skimap.org as sources?
Run filtering and segmentation
OpenSkiMap provides 230,420 runs, which we filter in several steps to the downhill terrain that our spatial metrics require.
A run’s geometry is either a line or a polygon, a distinction that originates with how OpenStreetMap contributors trace the trail and that OpenSkiMap preserves. A line follows a skier’s path as an ordered sequence of points, to which OpenSkiMap adds an elevation for each longitude and latitude. A polygon instead outlines the boundary of a cleared trail area. We retain the 216,326 line runs and discard the 14,094 (6.1%) polygon runs. A descending sequence of points defines the direction of travel, from which orientation and slope follow directly, whereas inferring a skier’s trajectory within a polygon would require modeling the enclosed terrain. In addition, wide trails are often mapped as both a polygon and a line down the middle, so excluding polygons forfeits less terrain than their count suggests.
OpenStreetMap tags each run with its supported uses. We retain the 97,457 line runs (45.1%) designated for downhill skiing, setting aside nordic, ski touring, hiking, sledding, and other uses.
We then sanitize each run’s coordinates by dropping points with missing or implausible elevations and collapsing repeated points. Upstream data defects motivated these safeguards, several of which OpenSkiMap has since fixed in response to our reports: the current snapshot loses only 2 of 1,441,920 downhill run coordinates to cleaning. Finally, we orient every run downhill, reversing any whose coordinates ascend. Note that direction matters: a run traced bottom-to-top would report a bearing opposite to the direction a skier travels.
We decompose each run into segments, i.e. the straight paths connecting consecutive coordinates. For each segment, we compute the horizontal great-circle distance, the vertical drop, the 3D distance combining the two, the slope, and the compass bearing. Segments are the atomic unit of our analyses: metrics for a run, a ski area, or any other grouping (e.g. all runs in New Hampshire) aggregate over constituent segments, typically weighted by vertical drop. In total, the downhill runs comprise 1,344,461 segments, descending 11,263 km of combined vertical drop over 54,116 km of combined 3D distance.
Ski area filtering
OpenSkiMap provides 12,387 ski areas, of which we retain the 6,951 (56.1%) that support downhill skiing. Since ski area metrics aggregate over member runs, a ski area’s own geometry does not require filtering. We count each ski area’s lifts from the lifts dataset, considering only operating lifts. Downstream analyses apply further filters as their comparisons demand, e.g. restricting to operating ski areas, those equipped with at least one lift, or resorts with at least five lifts.
Orientation
A segment’s bearing is the compass direction a skier travels while descending it, where 0° is due north and 90° is due east. We refer to the distribution of bearings across a group of segments, e.g. a run, a ski area, or all of France, as its orientation.
Downhill skiing is the art of descent. Accordingly, when aggregating bearings, we weight each segment by its vertical drop, such that a steep pitch counts for more than a flat traverse of the same length. Weighting by vertical drop also suits our sunlight estimates, since a level segment receives the same solar irradiance regardless of its bearing.
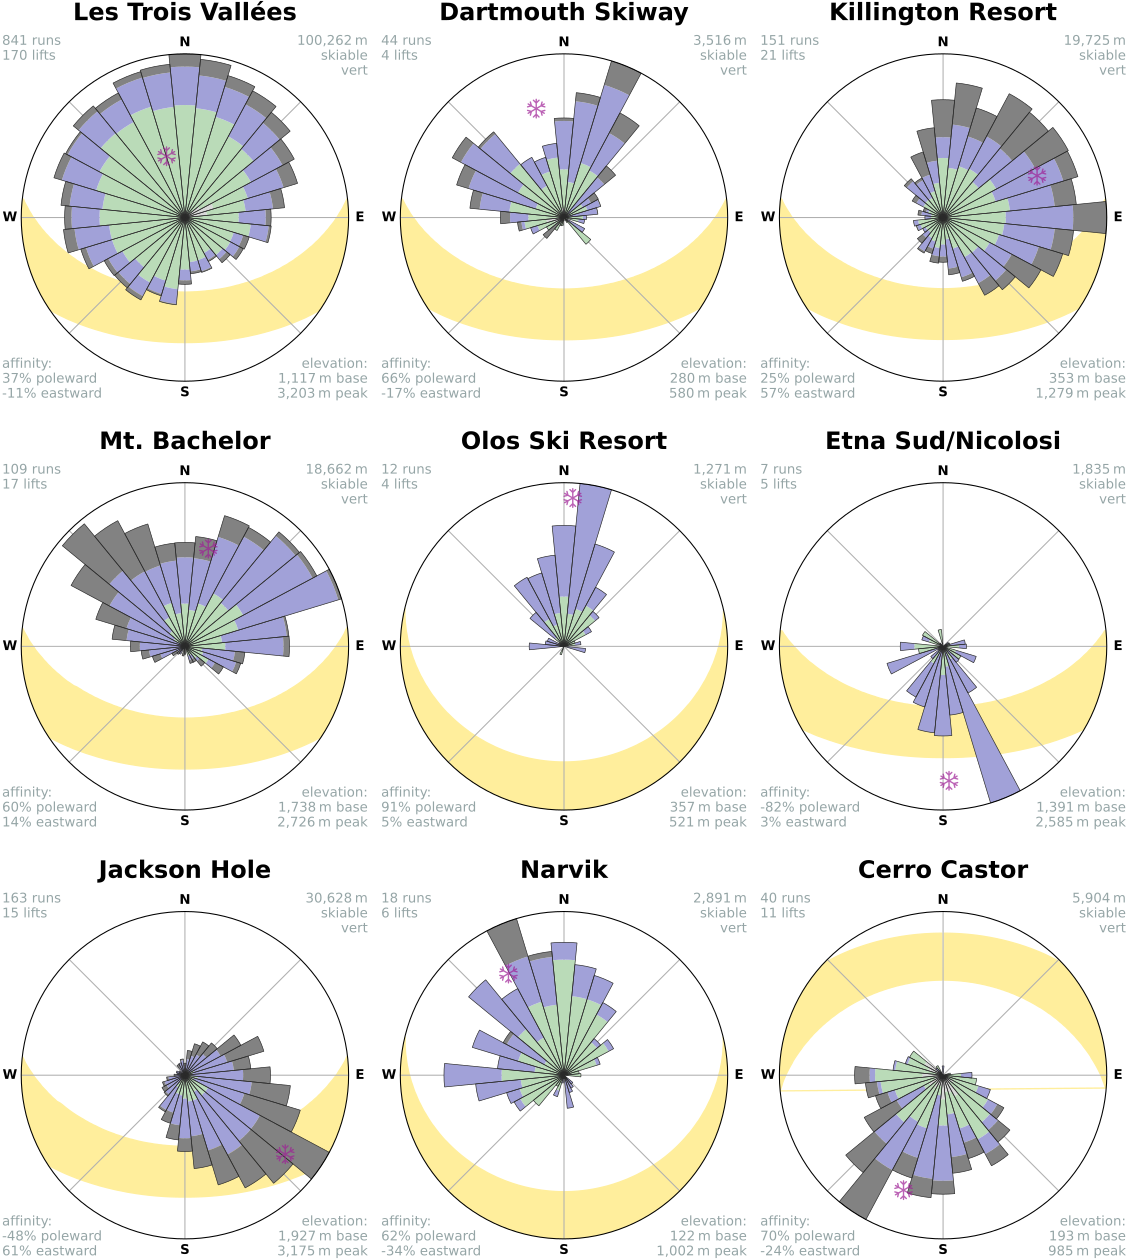
We tabulate the weighted bearings of a group of segments into a polar histogram that we call a ski rose, adapting the street network roses of Boeing [20,21]. Figure 6 illustrates the tabulation, highlighting the segments of the Dartmouth Skiway that fill a single petal. By default, roses use 32 bins, one per wind of the traditional 32-wind compass rose. Bins center on their wind, such that a common bearing like due north bisects a petal rather than splitting across two. We draw petals with area, rather than radius, proportional to their weight, avoiding the perceptual exaggeration of dominant directions that plagues many wind roses [23]. Petals can be subdivided by run difficulty, colored according to the locale’s difficulty coloring convention.

To summarize a group of segments beyond the rose, we treat each bearing as a vector whose magnitude is the segment’s vertical drop and take the vector sum. The direction of the resultant vector gives the mean bearing, while its length relative to the summed magnitudes gives the alignment, a 0–1 measure of how tightly the segments concentrate around the mean bearing. Decomposing the resultant vector likewise yields two signed metrics ranging from −1 to 1: poleward affinity, the component toward the pole of the segments’ hemisphere, and eastward affinity, the component toward due east.
Analyses that pool or compare segments across hemispheres first convert each quantity to a hemisphere-neutral form. Latitude becomes absolute latitude, e.g. Cerro Castor at 54.7°S is treated like a ski area at 54.7°N. Bearings undergo a hemispherical flip, mirroring southern bearings across the east–west axis such that due south becomes due north while due west remains due west. The flip expresses orientation relative to the pole and equator rather than the compass, and accordingly flipped figures label their orientation axes poleward and equatorward in place of north and south.
Orientation versus aspect
Aspect is the downhill direction of the terrain surface itself, i.e. the compass direction of the fall line, whereas orientation follows the skier’s path of travel. The two coincide on a trail that descends straight down the fall line and diverge on a trail that traverses across it. We chose orientation first for its availability: it derives from the run coordinates that OpenSkiMap already provides, while aspect requires computation over adjacent terrain from an elevation model. Resolution compounds the difficulty, as trails that traverse the fall line are often graded during construction, so their surface can tilt differently than the surrounding slope. Aspect does hold one clear advantage: it applies to any terrain, including the polygon runs that orientation cannot serve.
The better proxy for sun exposure depends on the setting. On an open slope, aspect governs how directly sunlight strikes the snow. However, many ski trails are corridors cut through forest, and we speculate that the corridor’s orientation better captures the shade cast by its tree walls. Note that weighting segments by vertical drop likely draws orientation toward aspect, under the assumption that steeper segments more closely follow the fall line.
Run Difficulty
Difficulty assigned by ski area.
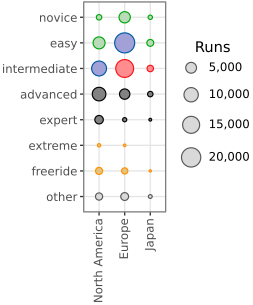
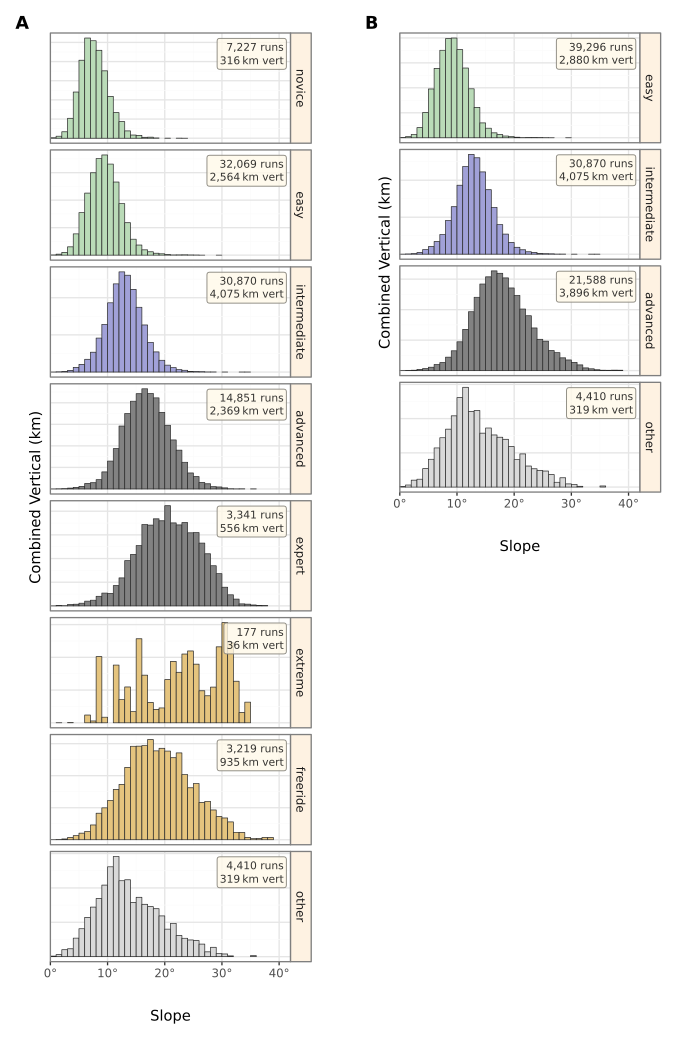
OpenSkiMap extracts run difficulties from OpenStreetMap according to the piste:difficulty key. We condense difficulties into a simplified set as follows: easy combines novice and easy; intermediate combines intermediate; advanced combines advanced, expert, extreme, and freeride; and other combines other and missing.
piste:difficulty key.
Sunlight
Solar irradiance is computed at the level of a run segment, as defined by its latitude, longitude, elevation, bearing, and slope. The segment is treated as a plane, analogous to a solar panel allowing us to use the pvlib photovoltaic modeling library for these calculations [27]. The Ineichen and Perez model with Linke turbidity estimates diffuse normal irradiance, global horizontal irradiance, and direct horizontal irradiance, under the assumption of a clear sky. We compute irradiance at 15 minute intervals for the duration of a typical 121 day ski season — December 1 to March 31 in the northern hemisphere and May 31 to September 28 in the southern hemisphere for the 2024 ski season. We average the irradiance over the ski season to compute solar irradiation in kilowatt-hours per square meter per day (kW/m²/day) along the segment. When averaging irradiation across segments, like when aggregating to the level of a run or ski area, we weight by the vertical drop of the segment.
Some shortcomings of these estimates are that they do not account for cloud cover, shadowing due to vegetation, and shadowing due to topography both on a micro (fine topographic variation like boulders, cliffs, moguls, etcetera) and macro scale (higher terrain like ridges or summits that block sunlight). We specify a surface type of snow in pvlib, which sets an albedo of 65%, i.e. snow reflects 65% of incoming light.

Software and data availability
OpenSkiStats is developed openly on GitHub at https://github.com/dhimmel/openskistats. A GitHub Actions workflow reruns the analysis weekly: it refreshes the OpenSkiMap downloads, recomputes every metric and figure, renders the website, and deploys the result to https://openskistats.org. This automation is the sole deployment route, making OpenSkiStats an example of continuous analysis, whereby a study’s computations rerun automatically so that its results always reflect the current code and data [28]. Even the manuscript rebuilds each run, interpolating its statistics from computed variables, such that the numbers throughout this study describe the latest data rather than a stale draft.
Quarterly, the workflow archives a snapshot of the analysis to Zenodo. Each snapshot deposits the exact inputs, source code, and outputs of a single run: the OpenSkiMap GeoJSON inputs with their download provenance, the repository source at the producing commit, the derived datasets of runs, lifts, and ski areas in Parquet format, the computed statistics, and the rendered website and figures. Zenodo mints a DOI for each snapshot as a new version of a shared record, providing citable, preserved releases independent of the continuously updating website. Deposit metadata links each snapshot to its producing commit and workflow run for provenance.
Licensing varies by component. Data derived from OpenSkiMap and OpenStreetMap is released under the Open Database License (ODbL), source code under the BSD-2-Clause Plus Patent License, and produced works such as the website, figures, and this manuscript under the CC BY 4.0 license.